|
||
|
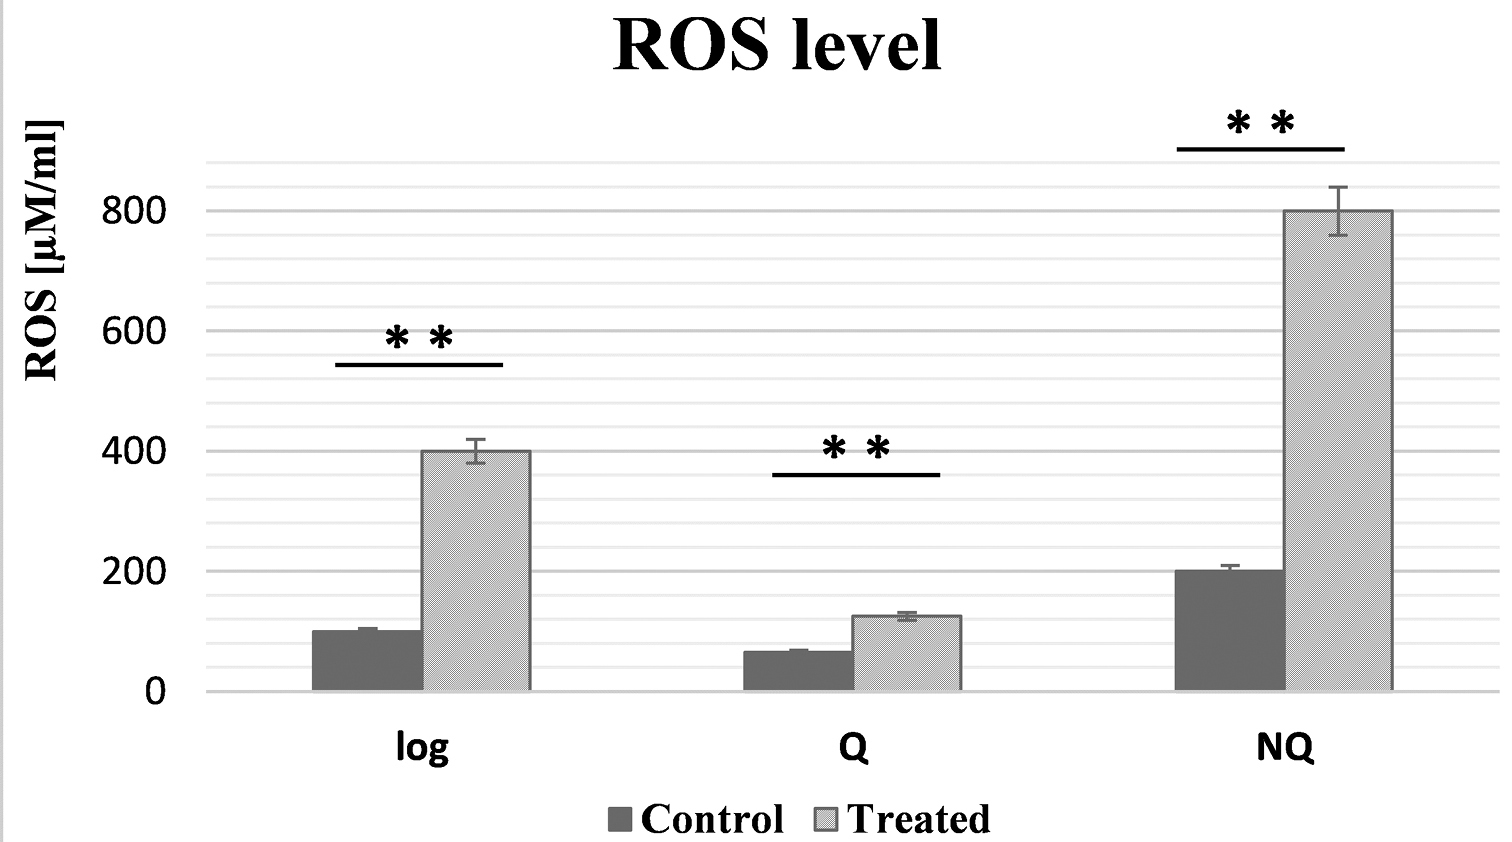
Comparative analysis of ROS levels in untreated (control) and Zeocin-treated proliferating, Q and NQ cells of S. cerevisiae BY4741. Each value represents the mean ± SEM (n = 3). Significant differences (* p < 0.05; ** p < 0.001) are presented. |
|
||||||||
| Part of: Marinovska P, Todorova T, Tomova A, Pisareva E, Boyadzhiev K, Dimitrov M, Parvanova P, Dimitrova M, Chankova S, Petrova V (2022) Saccharomyces cerevisiae yeast cells as a test system for assessing Zeocin toxicity. In: Chankova S, Peneva V, Metcheva R, Beltcheva M, Vassilev K, Radeva G, Danova K (Eds) Current trends of ecology. BioRisk 17: 105-116. https://doi.org/10.3897/biorisk.17.77227 |