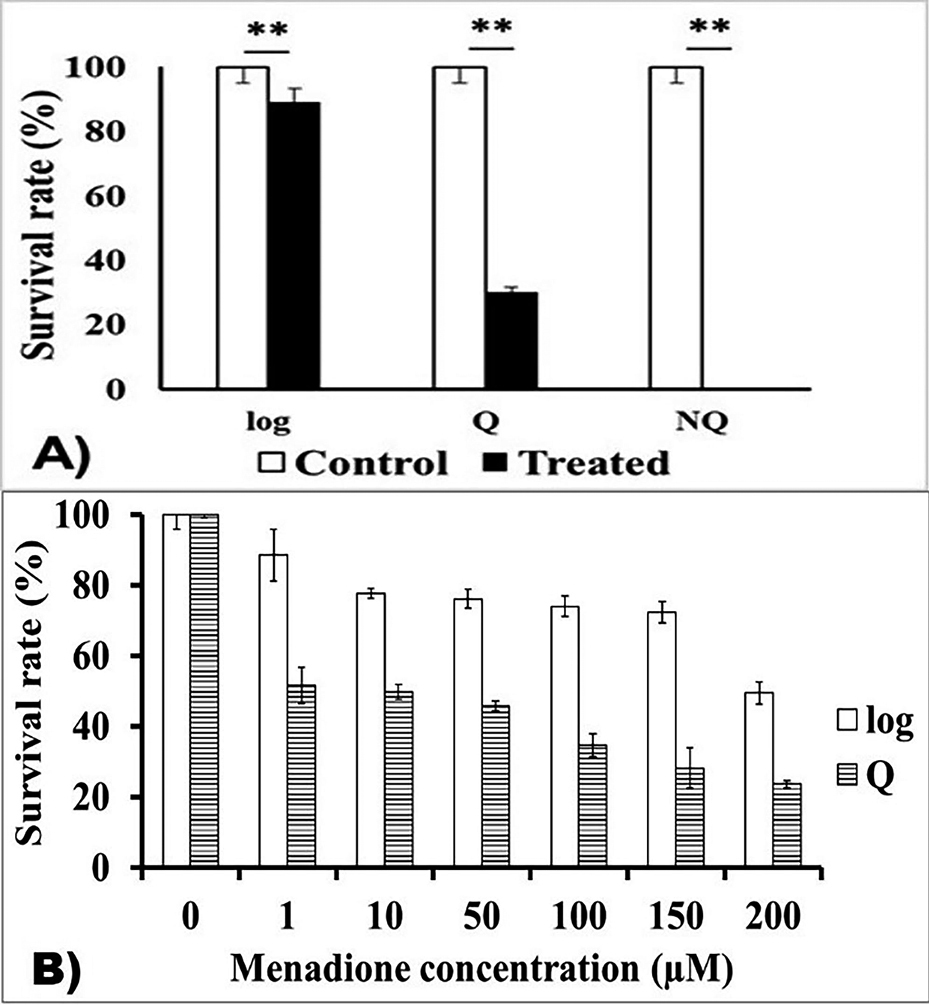
Cell survival after menadione treatment A effect of 100 µM menadione on log, Q, and NQ cell populations B effect of menadione in a concentrations’ range of 1–200 µM on log and Q cells. Each value represents the mean ± SEM (Standard error of the mean) (n = 3).


  Part of: Marinovska PG, Todorova TI, Boyadzhiev KP, Pisareva EI, Tomova AA, Parvanova PN, Dimitrova M, Chankova SG, Petrova VY (2022) Cellular susceptibility and oxidative stress response to menadione of logarithmic, quiescent, and nonquiescent Saccharomyces cerevisiae cell populations. In: Chankova S, Peneva V, Metcheva R, Beltcheva M, Vassilev K, Radeva G, Danova K (Eds) Current trends of ecology. BioRisk 17: 127-138. https://doi.org/10.3897/biorisk.17.77320