|
||
|
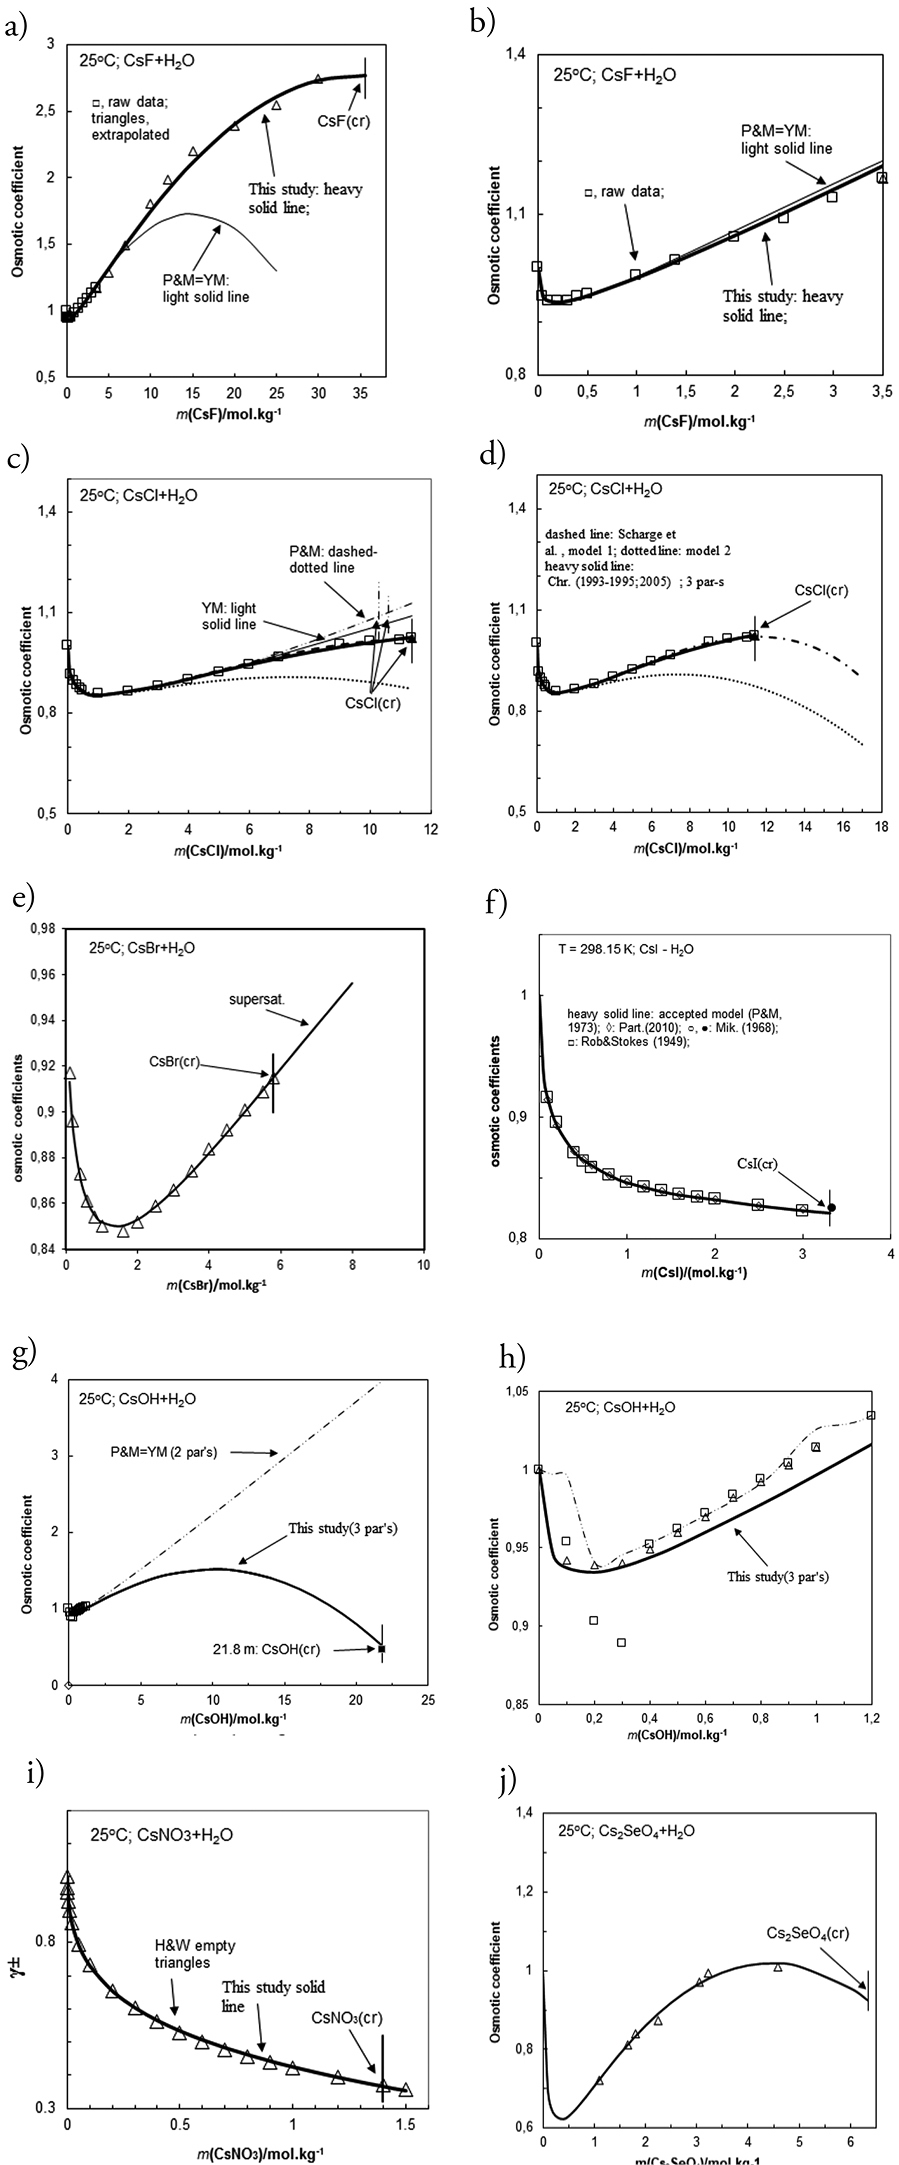
(a,b,c,d,e,f,g,h,i,j,k). Comparison of model calculated (lines) for activity coefficients (Fig.i) and for osmotic coefficients (ϕ) in cesium binary solutions (CsF-H2O, CsCl-H2O, CsBr- H2O, CsI-H2O, CsOH-H2O, CsNO3-H2O, Cs2SO4- H2O, and Cs2SeO4- H2O) against molality at T = 298.15 K with recommendations in literature (symbols). For CsF-H2O (Fig. b) and CsOH-H2O (Fig. h) systems an enlargement of the low molality corner is also given. Heavy solid lines represent the predictions of the developed in this study (for CsF-H2O, CsOH-H2O, and Cs2SO4- H2O systems) and previously reported and accepted models constructed by Christov and co-authors (Christov 2003a, 2005; Balarew et al. 1993; Barkov et al. 2001; Donchev and Christov 2020) and by Pitzer and Mayorga (1973) (for CsI-H2O). Dashed-dotted, dashed and light solid lines represent the predictions of the reference models of Pitzer and Mayorga (1973) (as P&M on Fig. a,b,c,f, g and h), of Scharge et al. (2012) (for CsCl-H2O and for Cs2SO4- H2O (Fig. c, d and k)), and of Palmer et al. (2002) (for Cs2SO4- H2O (Fig. k)) and of YMTB (given as YM on Fig. c and g) (Sandia National Laboratories (2005). Experimental data (symbols) are from Hamer and Wu (1972) (for 1-1 systems), Robinson and Stokes (1959), Mikulin (1968), Palmer et al. (2002) (for Cs2SO4- H2O), Partanen (2010) (recommended values for CsI-H2O) and from Barkov et al. (2001) (for Cs2SeO4- H2O). The molality of stable crystallization of solid cesium phases is given on all figures by vertical lines (see Table 1 for m(sat) sources). |